
A year has passed and it is time to summarize 2015 from the financial markets point of view and look ahead at 2016. If you follow the financial news, analyses and predictions abound, for example, Bloomberg's 2015: The Year in Money or Financial Times Forecasting the world in 2016, and every bank is letting their chief economists make predictions about the future (Goldman Sachs, Morgan Stanley, JP Morgan, Credit Suisse, etc.). I would like to highlight JP Morgan's long-term capital market assumptions especially, as they actually monitor the accuracy of their pasts predictions and show it in the reports.
At the global level, most forecasts for the growth in the world's GDP in 2015 fall in the range of 2.5-3.5% and, perhaps due to lack of foresight, they predict about the same for 2016. If we arbitrarily take the numbers from the World Bank as official, the 2015 GDP growth will come in at 2.8% and the 2016 growth is estimated to be 3.3%. When these are put in some context, the trend over last the 10 years looks remarkable solid, despite the world suffering from the aftermath of the Great Recession:
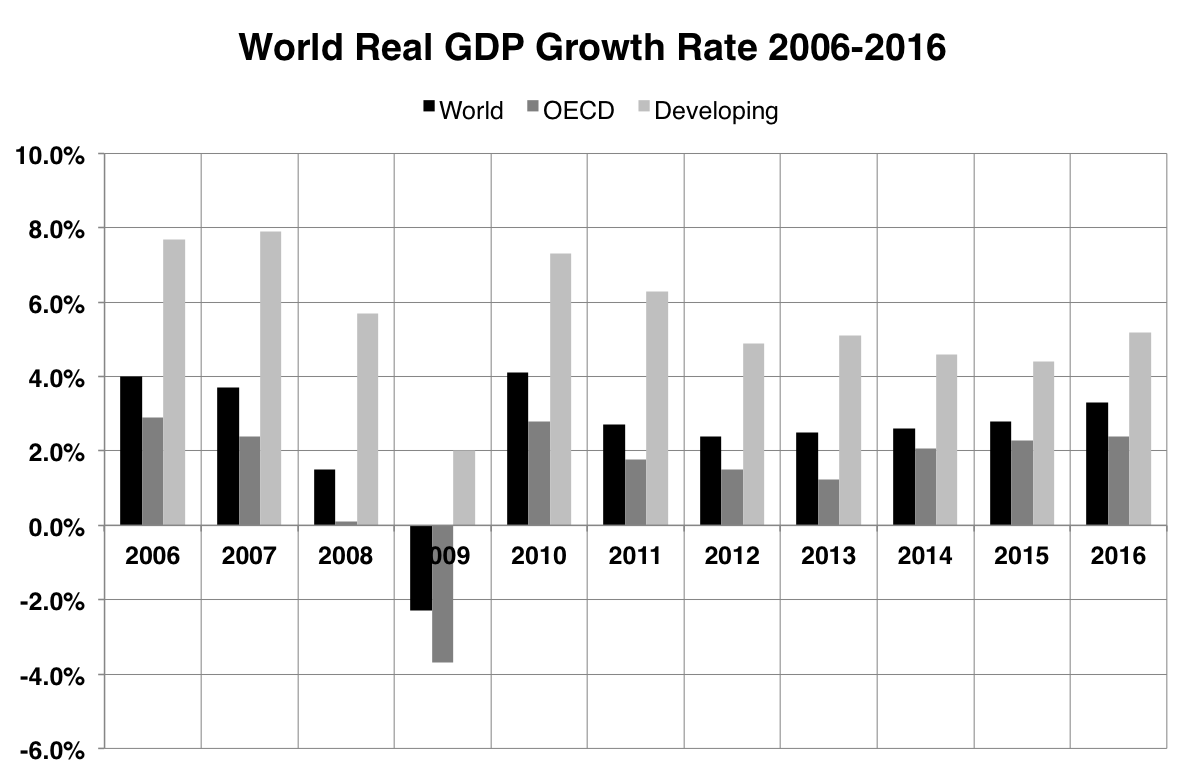
There is a widespread belief that China's GDP growth numbers are overstated, but even if we take that into account, it looks like the financial crisis was just a blip and the world economy keeps chugging on at >2% growth per year. Many economists and politicians are surely disappointed at merely 2% growth, but one has to remember that a 2% growth rate means a doubling every 35 years, or quadrupling over the lifetime of people born today.
Still, the real GDP growth should be compared to the population growth. According to the World Population Prospects 2015 (figure 3 in the linked PDF) the average annual population growth in the world during this period was about 1.2%, indicating that the true economic growth per capita is quite low, around 1%. This number is still respectable, especially when compounded over long time, but is probably not enough to live up to the expectations that many people (and politicians) have of rapidly improving living standards and early retirement.
Moving on the financial markets, the world of equities ended negative with a total return of -1.7% for 2015, as measured by the FTSE All-world index. Negative yearly returns for the stock market are quite unusual (typically 1 out of 10 years) so there are some grounds for concern here. Conversely, the power of mean reversion is very strong in the markets, so there are probably good odds for better returns in 2016, despite the fact that a recession and a stock market correction is long overdue from a purely historical and statistical point of view.
Within the long-term big picture, the year of 2015 follows a weak year of 2014, which came in with just +4.8% return on investment:
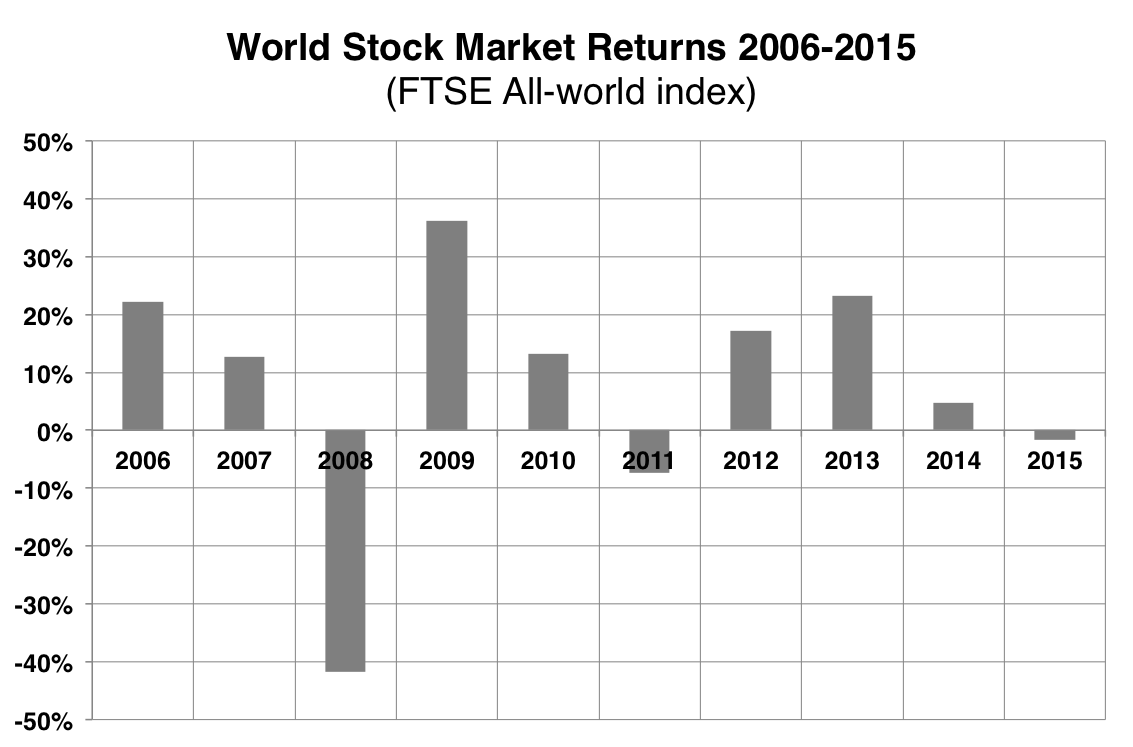
There was a great rebound in stock prices following the financial crisis. In my opinion, it was a result of mean-reversion and massive quantitative easing, but now it seems like the easy money has already been made in the stock markets with two lackluster years as a consequence. The poster child of poor performance in 2015 was the energy sector. In the US, the energy sector was down 24% due to weak oil prices. At the other end of the spectrum, the FANG stock complex of modern IT stocks (Facebook, Amazon, Netflix and Google) saw spectacular gains (33-130%), a sight, which to me is reminiscent of the 2000 tech bubble. Apple, on the other hand, did take part in the FANG party and retreated in line with the rest of the market. Outside the US, the main story of 2015 was, apart from the commodities crisis, the crash in the Chinese stock market, which ended 2015 down more than 10% after having peaked in April in a speculative bubble.
Looking ahead at 2016, the stock valuations look high in an historical perspective. The Schiller CAPE ratio is around 26 for S&P 500 index, which is close to the mark of 27.5, which was observed around the previous market high in 2007. On the other hand, the yearly P/E ratio is around 20, which is not exceptionally high. Judging from these numbers, I think it is definitely not out of the question that the markets can rise at least 5% next year (corresponding to CAPE 27.5 and unchanged earnings), but there is definitely a greater downside risk associated with a coming recession and a potential stock market decline.
Exactly how big a future stock market correction might be can be exemplified with two back-of-the-envelope calculations. The long-term stock market return for the S&P 500 index since 1988 (the beginning of the Greenspan era and post Black Monday) is surprisingly meager, being about 5.3% per year. The previous stock market low was 676 in March 2009, but there was likely some overshoot in this sell-off, so assuming that the real bottom was somewhere around 1000, a steady 5.3% increase per year lands the S&P 500 index at around 1400 in 2015. This shows that there is potential for a 33% stock market correction. John Hussman has pointed out that the fair value of the S&P 500 might be even lower, less than 1000, if you require 10% returns in the future.
Still, fair value is different from true market value and the mere fact that the market is now demanding higher interest rates to lend money can be interpreted as a sign of an improving economy and better potential return of investment. After all, it should be a good thing that the economy is undergoing normalization (as the economists call it). In order to support this view, I would like to construct a bullish scenario, where we instead use the S&P 500 low in March 2003 of about 1080 and extrapolate from there. We then arrive at an index value of 2060, which is very close to where the S&P 500 is at today, implying that the valuation is fair.
It is tempting to look back and predict that a big stock market correction must come to readjust the valuations, but I think it is a mistake to believe that the next crisis will look like the last one. The Great Recession was built upon a housing bubble, with other bubbles (housing bonds, derivatives) following as secondary effects. Now, we arguably have a bond bubble, driven by quantitative easing which generates inflated stock prices as a secondary effect. But instead of a outright crash, I think that the next crisis will be a slow earnings crisis, as corporate earnings will be very sensitive to interests rates due to the high leverage. There will come a time when the corporate bonds cannot be rolled over with lower interest rates and that should hurt the cash flow and the dividends for many blue-chip companies. That will be the trigger for a readjustment of stock values, but the process will happen slowly, as interest rates increase and the appetite for borrowing money decreases.
For the coming years, I see the possibility of a scenario where there is a sector rotation in the deleveraging process. The Chinese markets and the oil, gas and energy sector have already experienced a correction of the magnitude mentioned above, and the needle that pricks the balloon will likely move on to new targets over the next years. This could lead us to a situation in which there are massive losses in certain sectors of the stock market, while the market at large keeps afloat, similar to what we saw in 2015. This would create a "soft landing" and allow the excesses from quantitative easing to be worked off over a number of years. The downside would be rather poor stock market returns, as is predicted by the CAPE ratio. In that situation, I suspect that focusing on asset allocation will be central as the hot money will chase the winners of the moment (such as FANGs during 2015), while selling the sectors that are deleveraging. To succeed in the markets, it will be crucial to learn to identify and avoid the bad sectors, and conversely, to avoid big losses, it will be even more important to stay diversified.