
It is customary to see the news reporting being dominated by bad news. Every day, we tune into the message of a world slipping into chaos. This is one of the big contradictions facing an analytical mind trying to understand the world by reading up on it. The world might actually become a better place every day, but you would never know about it just by reading the daily news!
The standard explanation for why bad news sells better than good news appears to be a built in negativity bias in the human psyche. We have a propensity for preferring the deeper shades of black. The concept of negativity bias might have been popularized recently by Daniel Kahneman in the bestselling book Thinking, Fast and Slow, but it unlikely that the nature of news reporting will change anytime soon. There are examples of positive news curations, for example, the Good News section in Huffington Post, but it is striking that it comes across as being almost comically cheery and full of cute babies and puppies.
So in order to form an unbiased view of the future, it is important to try to take a step back and actively gather some positive news and trends to balance the scales. One of the best ways is to look at data and statistics.
Human Development Index
One example of how the state of the world has steadily improved for the last 35 years is a high level statistic of human wellbeing called the Human Development Index (HDI), calculated by the United Nations Development Programme (UNDP). It attempts to derive a metric of development and quality of life by combining statistics for life expectancy, education, and income per capita for the countries of the world. The index and the human development reports were initiated by the Pakistani economist Mahbub ul Haq when he was a special advisor at the UNDP during 1989-1995.
The first report published in 1990 begins triumphantly with:
Life expectancy in the South rose from 46 years in 1960 to 62 years in 1987. The adult literacy rate increased from 43% to 60%. Primary health care was extended to 61% of the population, and safe drinking water to 55%. And despite the addition of 2 billion people in developing countries, the rise in food production exceed the rise in population by about 20%. Never before have so many people seen such significant improvement in their lives.
Below, I have plotted the HDI value for the entire world. The data comes from table 2 in the most recent HDI Report from 2015.
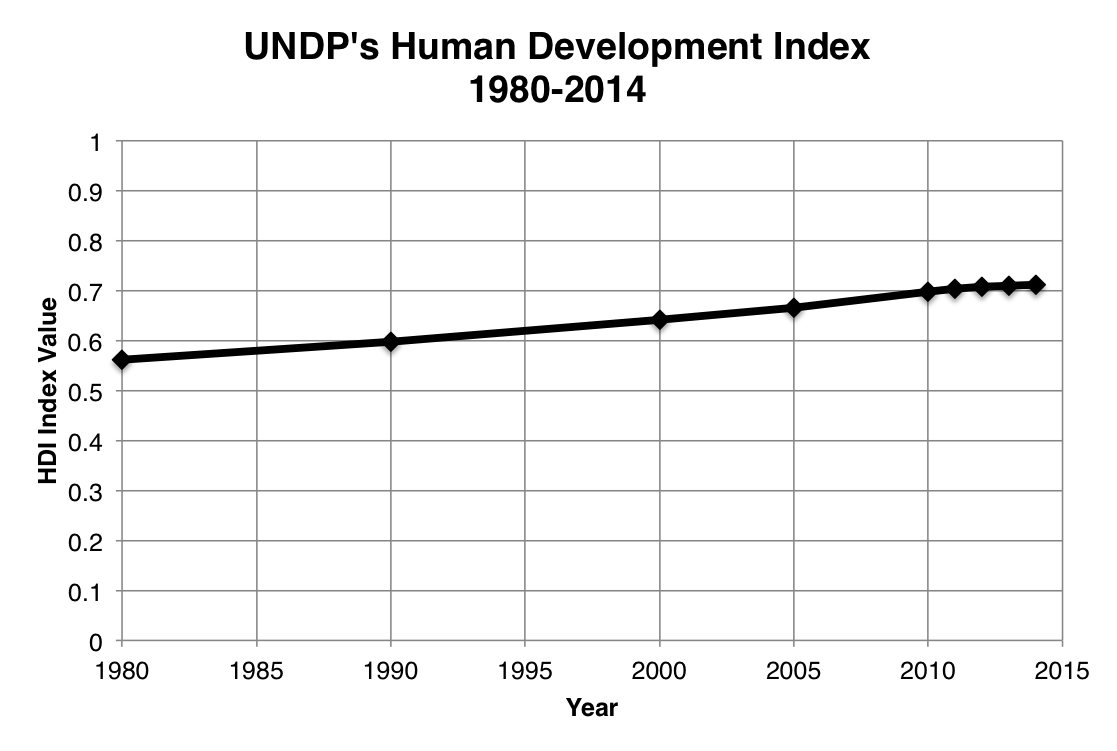
There is clearly a trend of increasing HDI. For reference, the index value of United States was 0.915 in 2014, China 0.727, and India 0.609. A struggling country, such as the Central African Republic measured 0.350. Despite the differences, wellbeing for the world as a whole is growing every year, as measured by the HDI, even though the pace has slowed in the last five years. It might be a result of the change of methodology in the calculating the index in 2011, but after accelerating up to 2011, the HDI derivative took a hit thereafter.
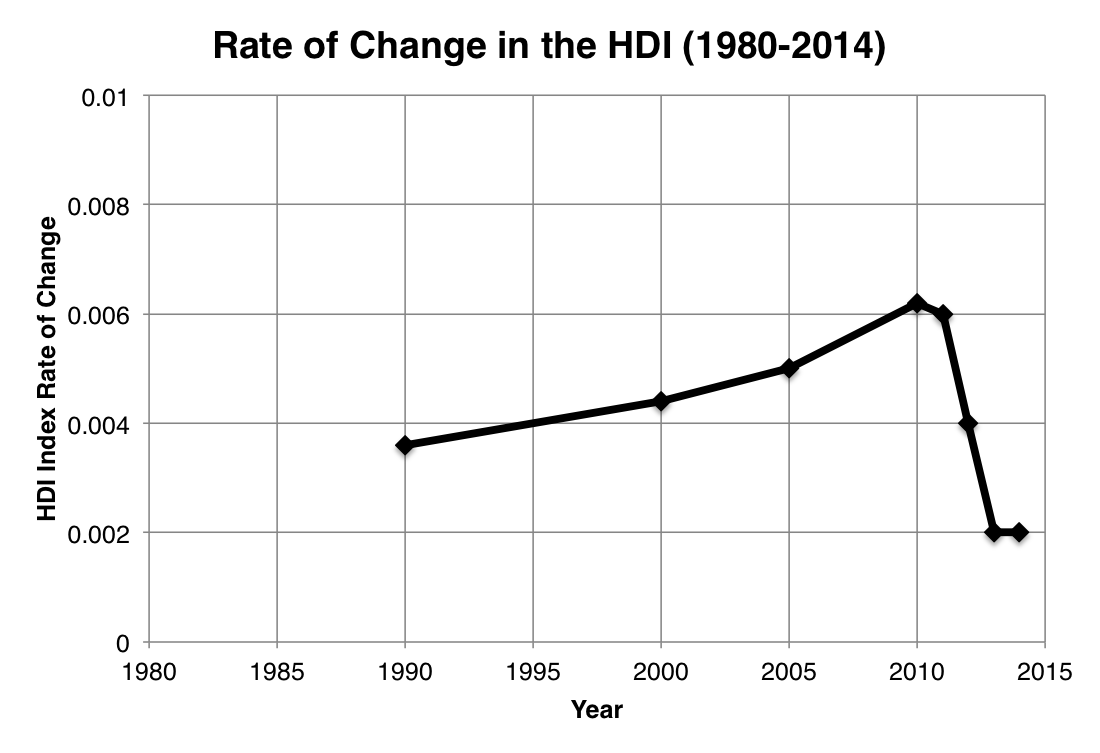
I imagine that the most likely cause is the global financial crisis, from which the world has not yet fully recovered, according to the HDI. But despite the slump, the rate of change of the HDI has still remained above zero, so the living conditions are improving (just like the world's economy overall is still steadily growing).
It is tempting to make some extrapolations of the HDI. A glance at the chart tells us that there seems to be a linear increasing trend. When will the world reach 1.0?
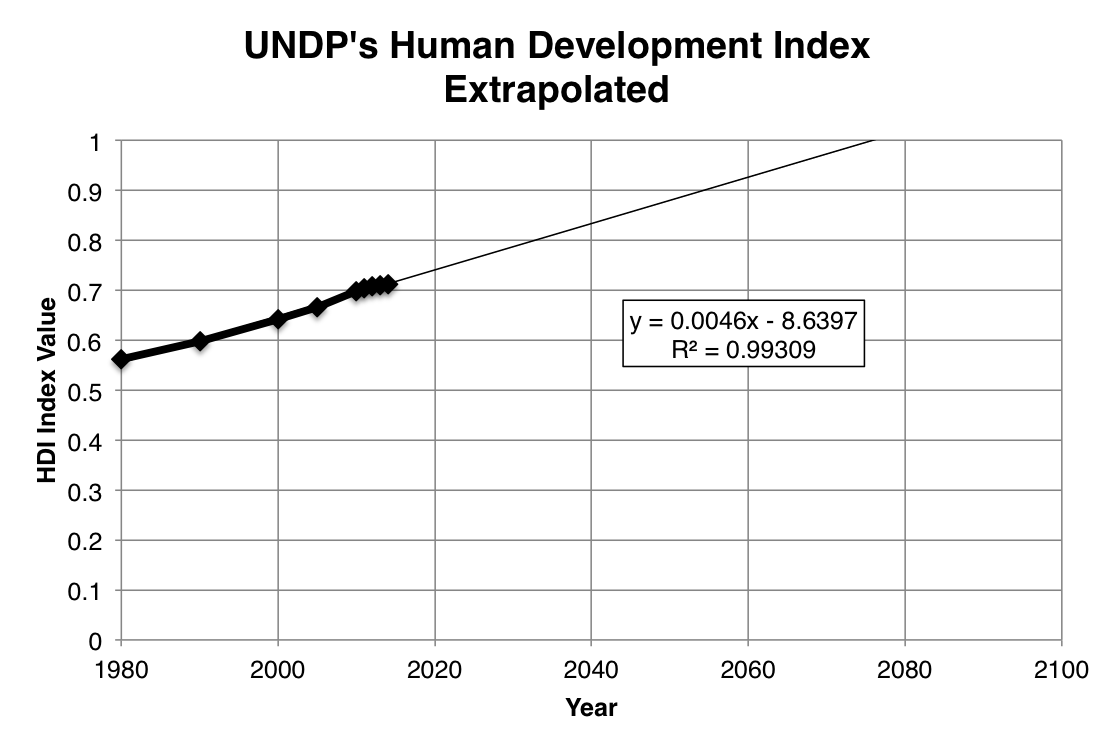
The linear fit is remarkably good (r^2 = 0.99), perhaps suspiciously so, but if we look at the chart as just a zoomed in segment in a greater trend of thousands of years of human development, it may not be surprising that the local segment of the curve is locally linear. The HDI index is a normalized value, so it is not entirely clear what an approach to 1.0 actually means, but it does look like most of the world's countries will have reached a Western standard of living (or better) by 2080 or so. That, if something, is a ground for optimism.